SaaS dashboard design: Best practices, key features & examples


TL;DR:
SaaS dashboard design is more than displaying charts and numbers. A good dashboard helps users understand data, make faster decisions, and complete tasks without confusion. This guide covers the different types of SaaS dashboards, essential features, and 12 dashboard design best practices. You'll learn how to organize KPIs, choose the right charts, design role-based views, improve data visualization, and avoid common UX mistakes. We also explore real SaaS dashboard design examples, the step-by-step design process, and typical design costs. By the end, you'll know how to build a dashboard that improves usability, user retention, and product performance.
The dashboard is the most important screen for a SaaS. It is the only screen most people see right after logging in. Many users keep it open all day. For startups, the dashboard often becomes the deciding factor in whether a user comes back and subscribes.
Good dashboard design helps users make decisions faster. A modern SaaS dashboard is not just a single product anymore. Integrations, email, chat, and MCP are all in here. A dashboard has to earn its place with newer users.
This Wavespace guide will cover what a SaaS dashboard is, types you can build, and features to include at each company stage. I will also share 12 best practices you can test against your dashboard.
This guide is for founders and product leads scoping a dashboard and for designers who want something to audit against.
What is SaaS dashboard design?
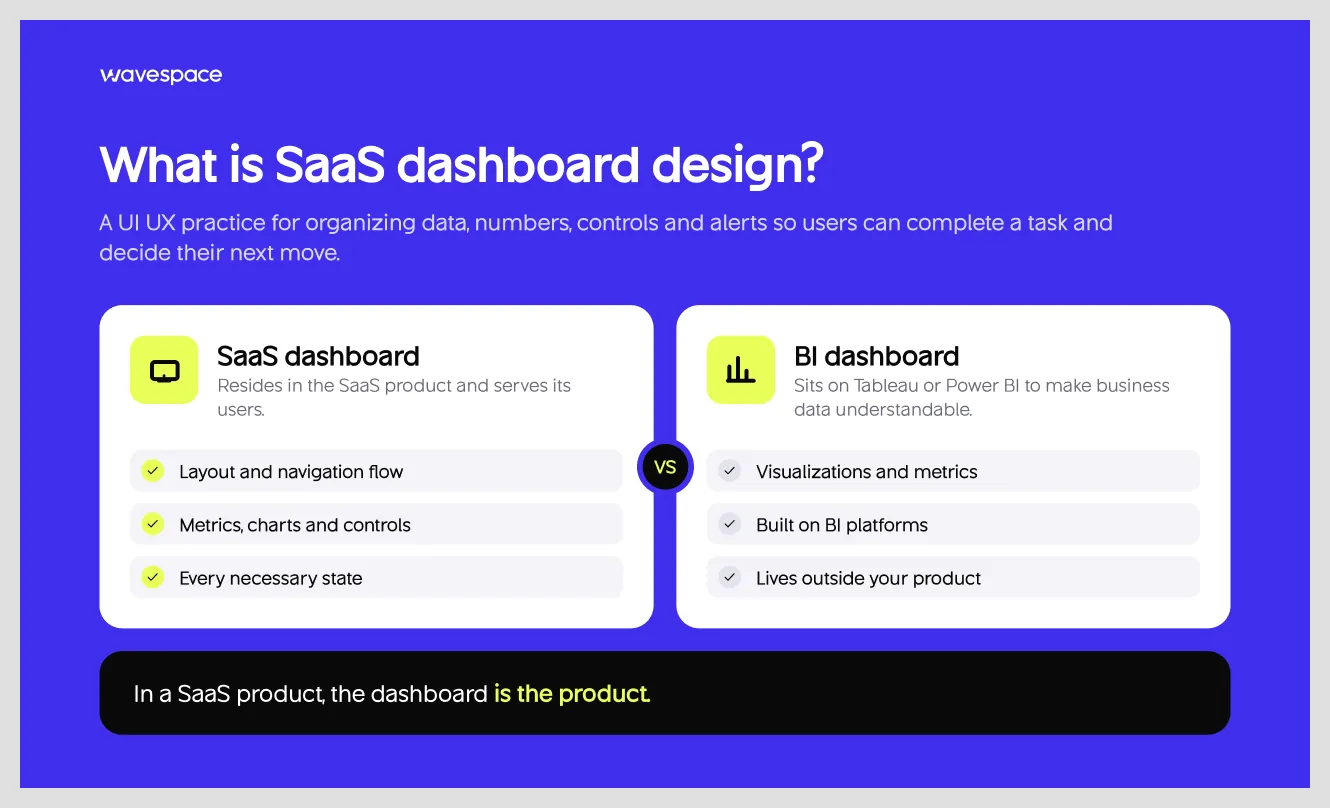
SaaS dashboard design is a UI UX practice for a specific part of a (software-as-a-service application) SaaS product design. It mainly covers displaying and organizing data, numbers, controls, and alerts on screen so users can complete that task and make decisions for their next move. Modern SaaS dashboard design covers layout design, metrics, charts, navigation flow, and every necessary state.
A SaaS dashboard is very different from a Tableau dashboard or a Power BI dashboard. A SaaS dashboard resides in the SaaS product and serves the users. On the other hand, a BI dashboard sits on top of business intelligence platforms to make data understandable.
The core difference between a dashboard and a Tableau & Power BI dashboard is that BI dashboards exist to analyze data. A SaaS dashboard exists to help users get work done inside the product, and it may include charts along the way.
In a SaaS product, the dashboard is the product. Most customers use it and spend their time on it. Also, the key part of user retention in B2B SaaS dashboard products. In 7 years in the design industry, I have seen good products struggle just because of confusion in the dashboard.
A SaaS product or idea means nothing when users leave mid-workflow out of frustration. A SaaS dashboard needs to be a predictable flow that matches users' mental model.
You can achieve it with the right and user-friendly dashboard UX decision. In practice, show important information first, encourage users to take action, turn data into insights, keep navigation predictable, and guide users.
Why dashboard design makes or breaks a SaaS product
Depending on the SaaS product, a user can use it daily or 2–3 times a week. Every click repeats. Founders track these numbers: time-to-value, activation, user retention, churn, support load, and expansion revenue.
Good dashboard design is related to these numbers. If a new user lands on an empty or confusing dashboard, they have to work around to get a taste of the SaaS product. In SaaS UX, users leave when a task takes longer than expected. Dropping a user empty-handed increases task completion time, and they leave for an alternative.
That is an activation problem and a time-to-value problem, and the dashboard is where it gets solved or gets worse. This is why SaaS dashboard design makes or breaks a SaaS product.
According to the 2026 State of Onboarding Report, insights from 161 leaders found that “57% of companies that reduced their onboarding investment saw churn increase within six months.” This shows how much the first experience matters, and in a SaaS product, the dashboard is that first experience.
Two to three months into a customer's subscription, that same dashboard affects retention and churn. Renewal conversations get harder if a user can’t tell if the product is working as intended. Support tickets pile up with basic questions.
Discovering new features and expansion revenue also depends on the dashboard design. The dashboard is the right medium for users to discover new features because not every user will read your new feature newsletter.
That’s why I always recommend founders spend on UX. A 2016 Forrester report says every dollar spent on UX gives an average return of a hundred dollars. However, don’t treat that as a promise. But good UX is important for all digital products. UX design and research help your product by removing friction from everyday software.
Types of SaaS dashboards (and which one you need)
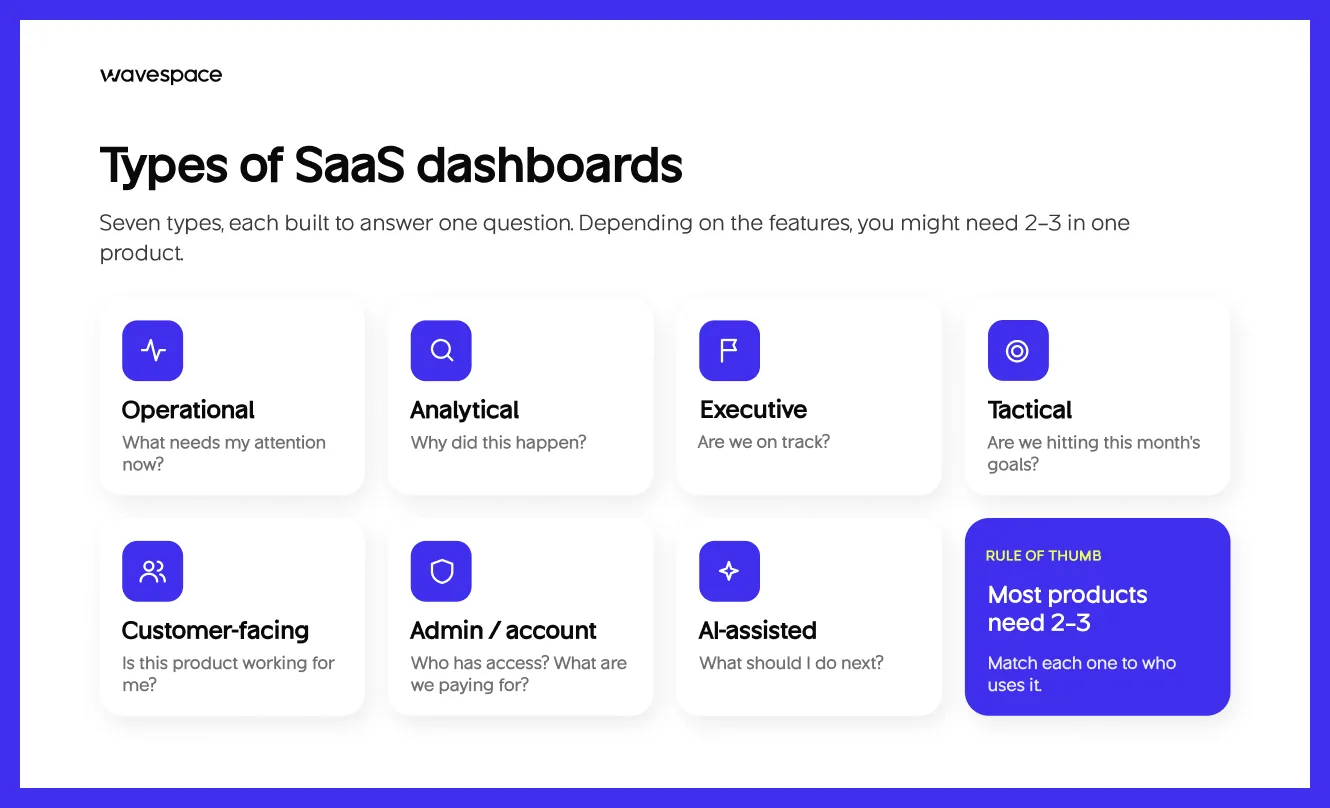
Usually, SaaS dashboards fall into one of seven types. The first four are the most discussed. The other three are specific types of SaaS products. Depending on the features, you might need 2-3 dashboards in your SaaS product.
The operational dashboards are built for scanning. They help support and operations teams find issues easily. Operational dashboards show live, up-to-date information so teams can quickly identify and fix issues.
The analytical dashboards are used by analysts and PMs to find why something happened. Analytical dashboards let users explore past data, apply filters, and gain deep insights into the numbers to find patterns and causes.
A strategic or executive dashboard tells leadership about the company's situation, whether the business is meeting its goals. These dashboards show a few key numbers, updated daily or weekly.
A tactical dashboard helps team leaders check progress against the current month’s goal. It shows daily updates and a moderate amount of information needed to make a decision.
A customer-facing dashboard is what your customer sees inside your SaaS product. These dashboards are the workplaces where things get done. Information density depends on the SaaS product.
Admin or account dashboards are for administrators. It is designed to cover access, billing, and setup. These dashboards need clarity over a fresh look. UI and UX for this dashboard should be easy so admins can create, edit, modify, and delete quickly.
An AI-assisted dashboard suggests next steps. It tells users, admins, or anyone with a role what to do next. These are low-information density by design. The heavy lifting is done by AI underneath, and only actionable steps are displayed.
Anatomy of a SaaS dashboard
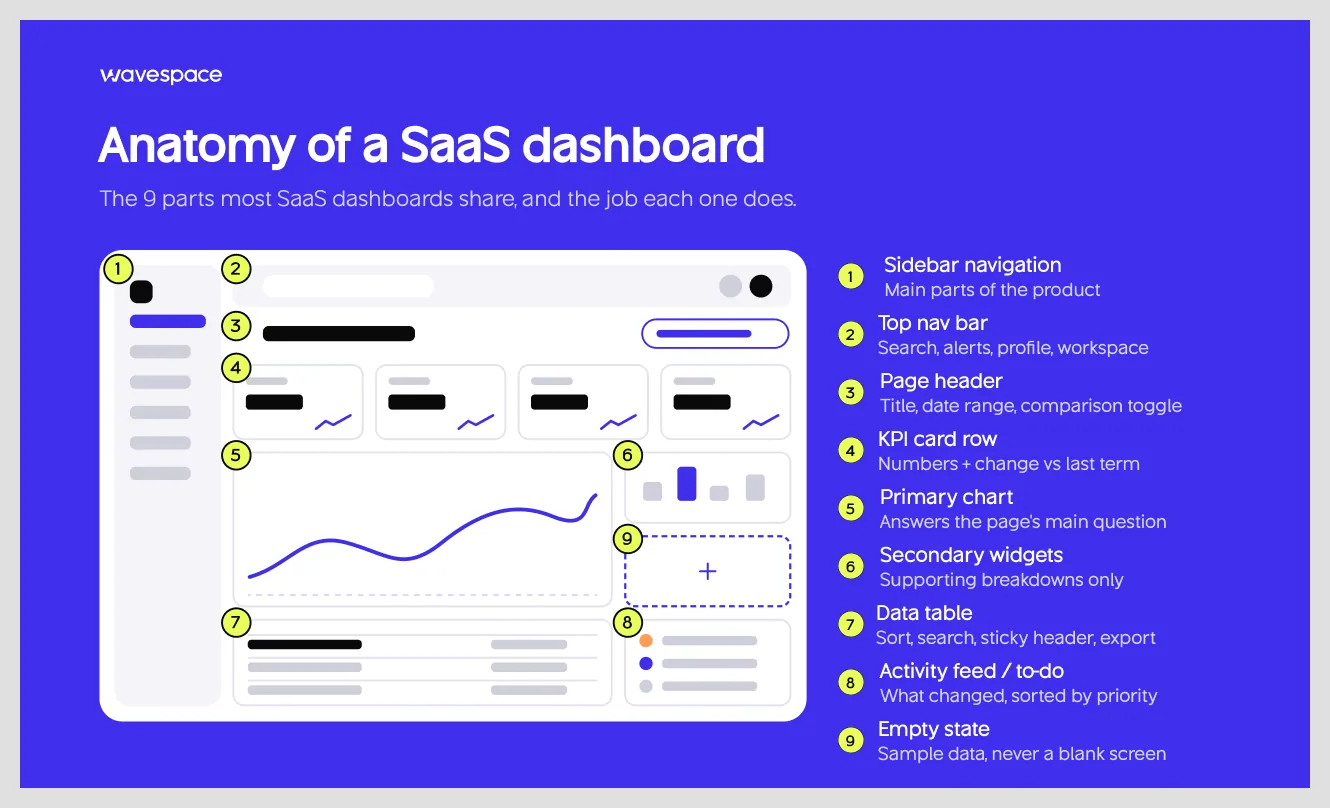
Most digital products share almost the same SaaS dashboard, with some exceptions. Here is what each one actually does and the mistakes most people make. I will break down the structure of a SaaS dashboard and what you should not do.
- Sidebar navigation: A SaaS dashboard sidebar navigation panel holds the main parts of a product. The usual mistake is adding too many items in it or labels that just name features, not the work.
- Top nav bar: It carries the global search, notification, account or profile menu settings, and the workplace switcher. It goes wrong when page-level actions crowd in.
- Page header: It displays the page title, date range, or comparison toggle. Most mistakes other SaaS dashboards make are that they hide the date range. As a result, users can’t tell properly which timeframe they are working on.
- Analytics or KPI card row: SaaS dashboard cards display analytical numbers and their change from the previous term. The usual mistake is overdoing it with too many cards or showing numbers with no comparison.
- Primary chart: The most important visual chart on any SaaS dashboard that answers the page's main question. SaaS dashboard starts to suffer when two other charts of the same size compete on the screen. Make the main chart larger and use a smaller design for the secondary chart.
- Secondary widgets: They add supporting breakdowns of the primary data or analysis. The biggest mistake is using widgets to fill space. Use when it's necessary.
- Data table: It provides values to understand the report or data, with options to sort and filter. Tables fail when there are no options to sort, search, sticky header, and no import & export option.
- Activity feed or to-do list: It shows the important things, what has changed, and what needs attention. It fails when it lists everything without order. Sort or categorize them by priority.
- Empty state: It’s what users see before any data exists, and it should guide them to add data. The common mistake is leaving it blank or not showing sample data.
Key features every SaaS dashboard needs
There are some SaaS dashboard features that cannot be missed. Even if you release your product without them, you will need them after a few months. Our UX designers have curated them so you can understand how a SaaS dashboard can become more efficient.
KPI cards with trend context
A KPI card shows the current value, the change against the last period, and a small sparkline. A user needs all three for a better grasp of the situation they are in, because numbers alone don’t speak well. Visualization makes them easy to digest.
Design tip: Show the changes as a percentage with an arrow, drawing the sparkline over the same term.
Date range and comparison controls
Every number on a dashboard describes something in a period, so users need to see every change in that time frame.
Design tip: Keep the selected range visible and put the date, range, and comparison controls on the page header. So that users can quickly find what data they are looking for. This gives more freedom to the users.
Filters and segmentation
The filtering option gives more control to users and lets them find data by team, plan, or region. Ultimately, users can answer every question in one dashboard.
Design tip: Show active filters as removable chips. Remember the user preference so users don’t have to filter every time.
Drill-down from summary to detail
Drill-down takes a user from a summary number to the records behind it. People need this because a surprising number raises questions the summary alone can’t answer.
Design tip: Make the card or chart segment clickable, and carry the filter context into the detail view.
Customization: drag-and-drop widgets and saved views
A customizable dashboard lets users rearrange widgets or save views for their daily tasks. It is important for SaaS software. Customization gives freedom to users to increase their efficiency on their account.
Design tip: Ship strong defaults first. Most of the users will stick to the defaults. After a few build versions, add customization.
Role-based views and permissions
Access controls what a role can do. Views control what it sees. A tech support and a finance admin don’t need to see the same screen. Role-based access keeps the dashboard clear, and users work faster with less distraction.
Design tip: Tell users why something is hidden, instead of leaving them hanging. For example, “Only managers can view this.”
Real-time updates, alerts, and notifications
Real-time data suits SaaS products that work in real time. For example, support queues and weather monitoring tools. Alerts notify status of unseen data when a visitor is not looking on screen.
Design tip: Let the user set or modify the alert conditions and pick the channel or medium. Also show the latest data so no user has to click refresh.
Global search and command palette (⌘K)
Global search finds records, and the command palette makes actions faster. Power users detest a SaaS product that doesn't support basic shortcuts. Power users love using them; it helps them do work faster. Because clicking through menus is slow when you already know what you want.
Design tip: Show the shortcut bind key inside the search field, and list recent items before the user types anything.
Sharing, export, and scheduled reports
Scheduled reports keep the dashboard useful when someone forgets to make a report. And users often need to get data out or share for different reasons. A CSV for finance, a link for a teammate or colleague, or a PDF for a meeting.
Design tip: Let the user export what they see with filters and date range applied. Make available different types of files for exporting. If you offer embedded analytics inside your product, ensure custom data control works in embed mode.
Onboarding and first-run experience
The first session carries a lot of weight in digital product design. A first-run experience shows a new user what the dashboard is for, what it does, and how it helps them.
Design tip: Replace empty charts with a clear next step, such as connecting a data source or creating a first project, and let the dashboard fill in as data arrives. Plus, add an option to rerun the onboarding experience with a click of a button.
Workspace / account switcher (multi-tenant)
In a multi-tenant product, a user is connected to more than one account or workspace. The switcher tells them where they are and lets them move. For example, Slack, Salesforce CRM, Notion, and HubSpot.
Design tip: Show the current workspace name in the top bar at all times, and keep each workspace's last view so switching doesn't drop the user on a home page.
AI insights and natural-language questions
AI insights point out patterns, such as a metric that moved unusually, and natural-language questions let users ask for a chart instead of building one. Good AI SaaS dashboard design keeps every answer inspectable.
Design tip: Show which data an insight came from, and let users open the underlying chart.
Here is how those features map to company stage.
12 SaaS dashboard design best practices
These dashboard design best practices cover what makes a good SaaS dashboard design. I'm adding a quick check you can run against your own dashboard screen to see whether it meets industry criteria.
1. Start with a decision
A dashboard's purpose is to support decisions. So start your dashboard UX with decisions. Ask what users are doing in spreadsheets, or ask a team what they're missing. Fill those gaps when rebuilding the dashboard. List the decision first, not the data.
Quick check: Can you name the decision each widget supports?
2. Design one dashboard per role
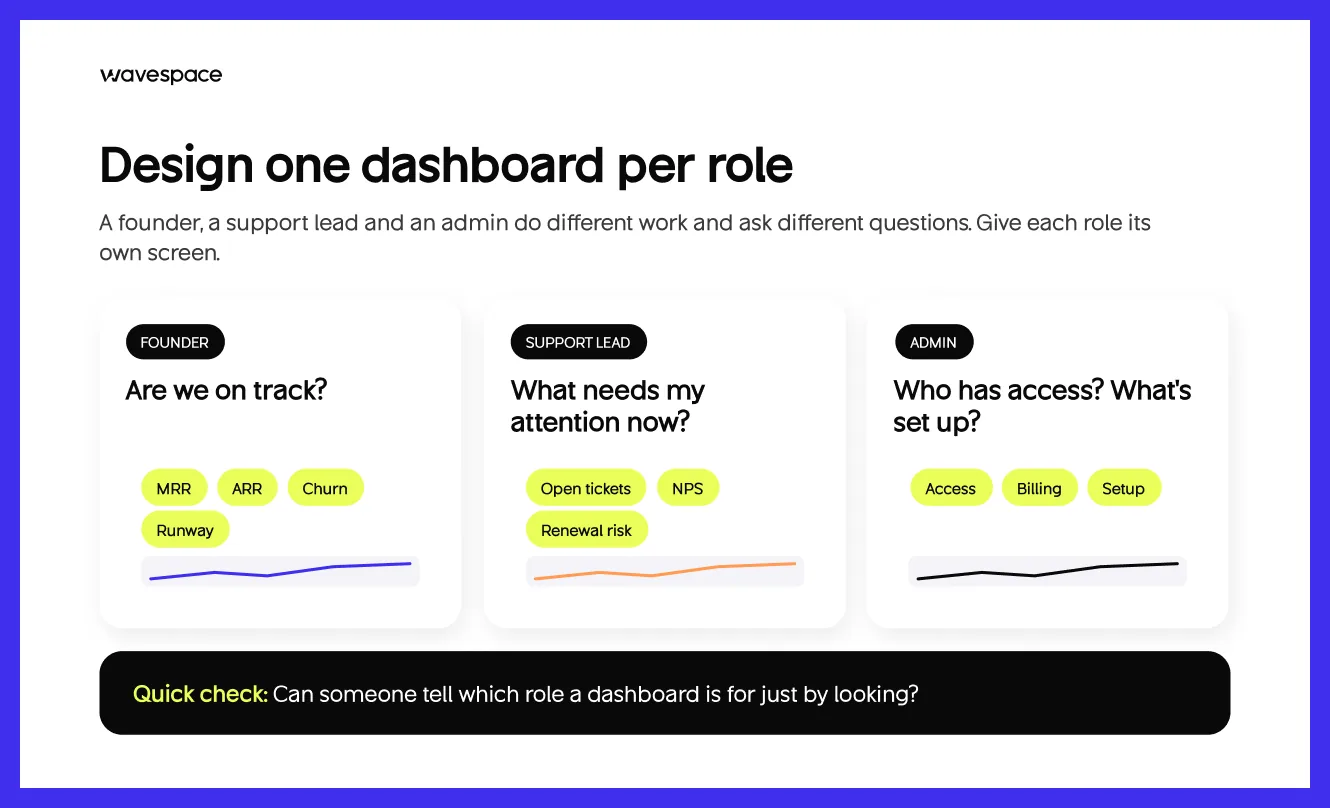
One screen for every user becomes messy and serves no one. A support lead, a founder, an admin, and HR all do different work and ask different questions. Design different dashboard screens for each role. You can check out our SaaS design work for a reference.
Split the dashboard by role or work, and use components from one design system so dashboard screens feel unified.
Quick check: Can someone tell which role a dashboard is for just by looking?
3. Keep the above-the-fold view to 5–7 primary KPIs
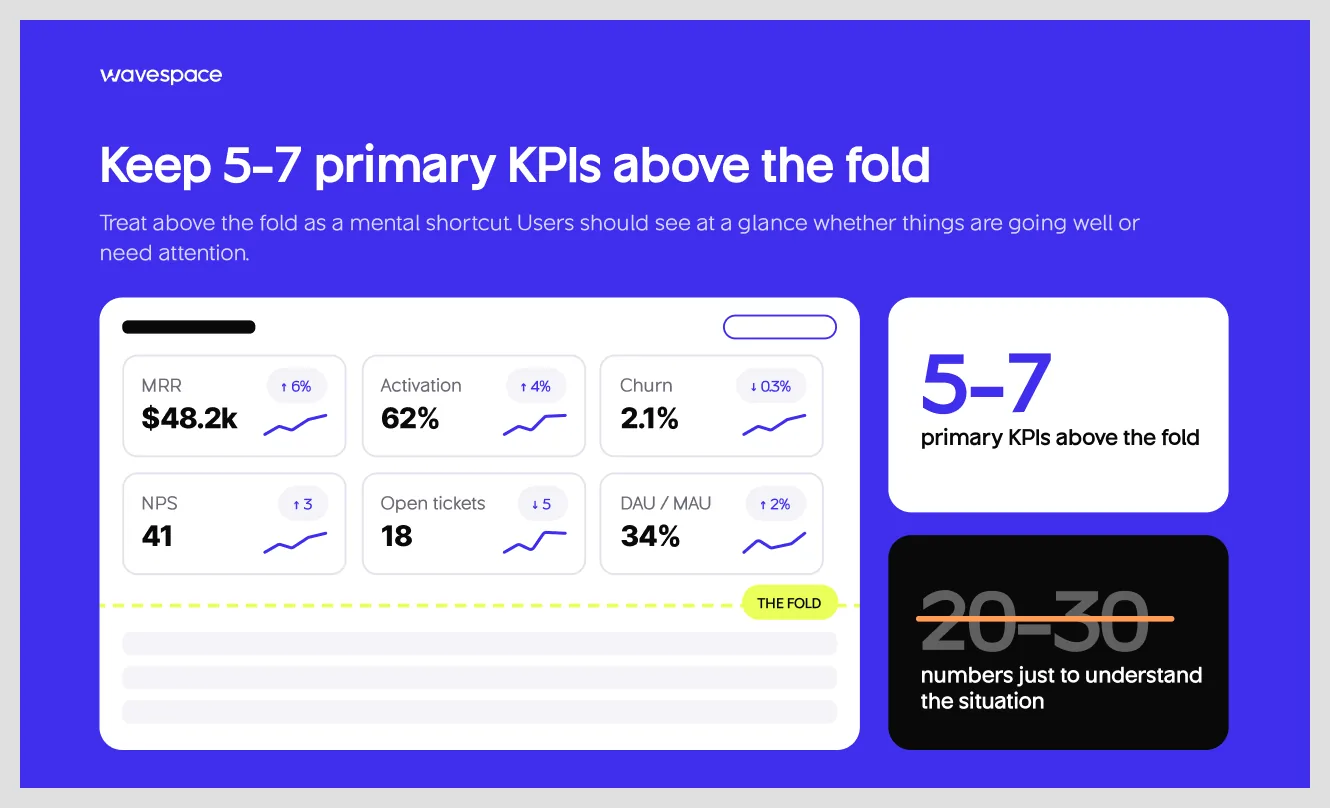
Treat the above-the-fold as a mental shortcut. Add five to seven important metrics. Avoid including 20–30 numbers to understand the situation. Users should be able to see the 5–7 metrics and tell whether things are going well or need attention.
Quick check: For each KPI, does the user know what to do if it dropped?
4. Take advantage of visual hierarchy
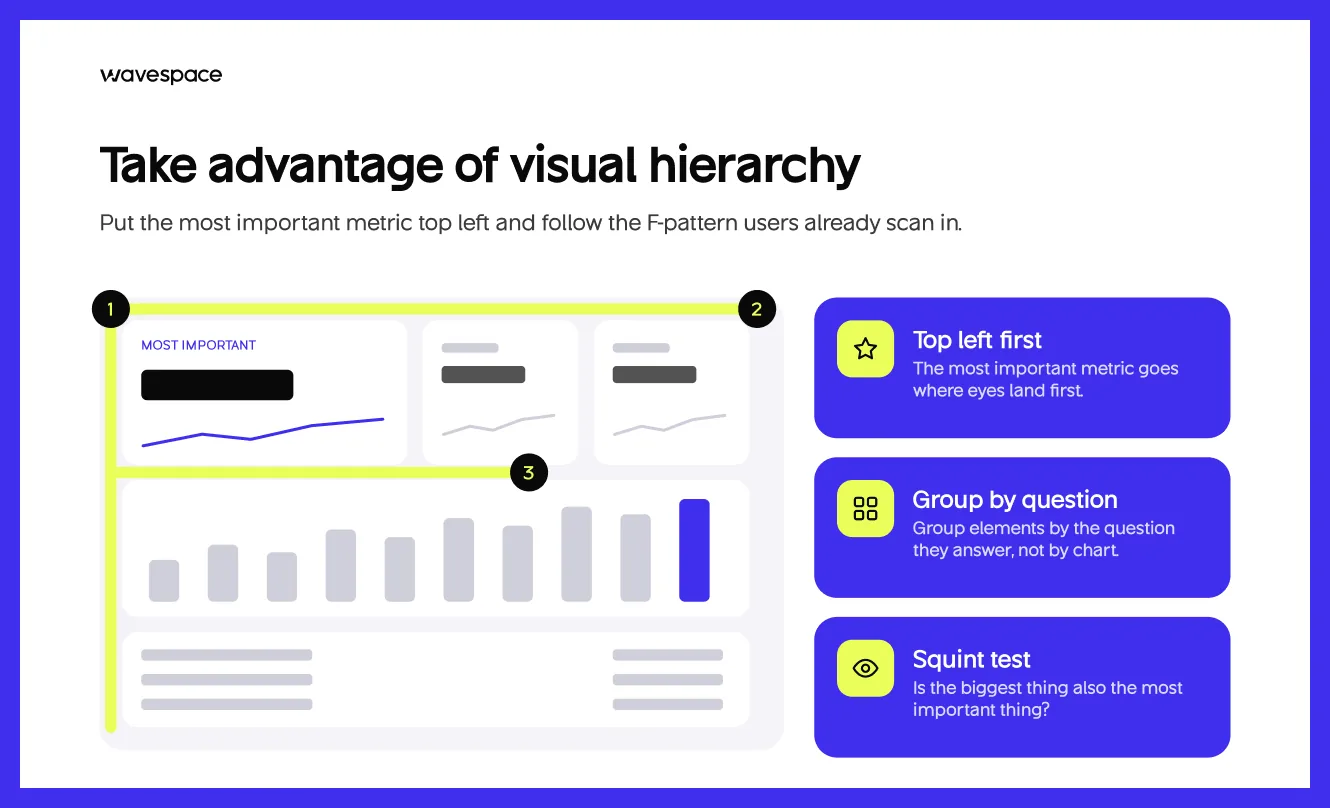
Put the most important metric at the top left so users can understand without fully reading. Follow the F-pattern to align with users' scanning behavior. Don’t group elements by chart; instead, group them by the question they answer. A good visual hierarchy helps users read the page in seconds. Use it to your advantage.
Quick check: Squint at the screen. Check if the biggest thing is also the most important thing.
5. Use progressive disclosure
Show a summary first and detail on demand. According to Nielsen Norman Group, “Progressive disclosure defers advanced or rarely used features to a secondary screen, making applications easier to learn and less error-prone.” On a dashboard, that means cards > charts > tables.
Quick check: Can a first-time user navigate pages without any help?
6. Pick the right chart for the question
Understand what the user wants to know before choosing the chart. Good data visualization is mostly about matching the two. This matrix covers the common cases.
Quick check: Would a table answer this faster than your chart?
7. Use color for meaning, not for decoration
Use red, amber, and green for status, but never rely on color alone. WCAG 1.4.1 asks for a second indicator such as an icon or a label. Put accessibility first in priority. Normal text needs 4.5:1 contrast (large text 3:1, WCAG 1.4.3), and chart elements and UI components need 3:1 (WCAG 1.4.11).
Choose colorblind-safe palettes for charts. This saves you from double work. A great choice for a SaaS dashboard color palette: one neutral scale, one brand accent, and a set of status colors.
Quick check: Does the dashboard still make sense in grayscale?
8. Design every state
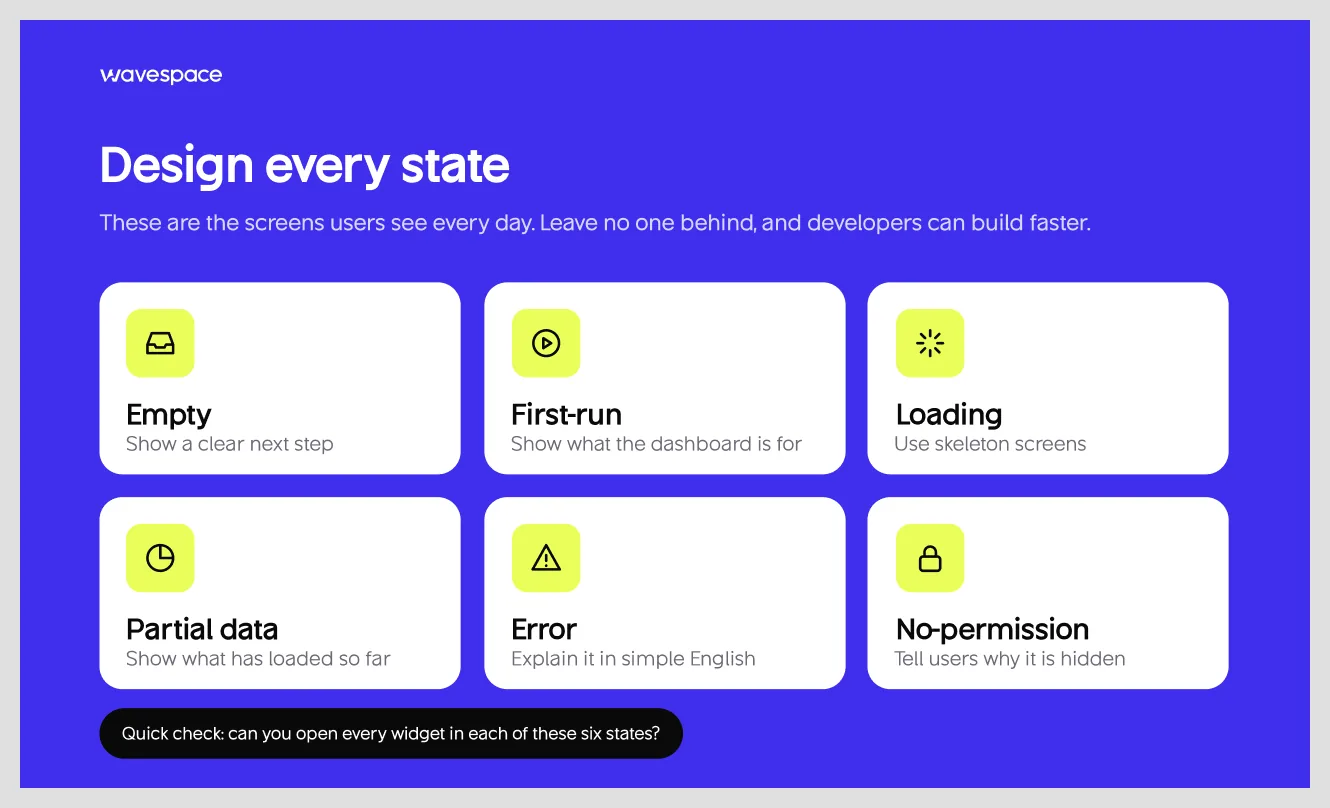
Design every state screen so developers can build quickly. Empty, first-run, loading, partial data, error, and no-permission leave no one behind. These are the screens a user sees every day in a dashboard. Use skeleton screens when data loads, a clear next step in empty states, and simple English in errors.
Quick check: Can you open every widget in each of those six states?
9. Context for every number
A number alone is not an insight. Put a comparison period, a target, or a benchmark next to each metric. This way, users can tell good from bad without asking anyone.
Quick check: Can someone tell whether each number is good or bad at a glance?
10. Make speed part of the design
A good-looking, slow dashboard feels useless. Use lazy-load widgets below the fold and show skeletons while data is fetched. Aim for Core Web Vitals in the good range: LCP ≤ 2.5s and INP ≤ 200ms.
Quick check: Measure both on the real dashboard with real data.
11. Design for smaller screens by reprioritizing, not shrinking
Don’t shrink the desktop layout. Reprioritize it. Find out which two or three cards matter most. Put them on the mobile screen first and hide other cards below the fold or behind a tap. Offer dark mode.
Quick check: Open the dashboard on a phone and check if the first thing you see is the first thing users need to know.
12. Build on a design system, test and iterate
Design tokens and components keep a hundred-screen SaaS project consistent. Once the design system is set, run five-second tests and task-based usability tests, and track which sections or widgets are least used. Iterate them to make it helpful.
Quick check: Which widget did nobody open last month?
SaaS dashboard metrics to track by role
The key metrics a SaaS dashboard should show depend on who is looking. These are the best SaaS dashboard metrics for each role. However, your metrics can be different based on your product.
Metrics sound like things getting done. But you need to separate the actionable metrics and vanity metrics. Vanity metrics do not contribute to business performance. A good dashboard shows metrics that drive decisions, not numbers that only look impressive.
- Vanity metrics tell you what happened but don't necessarily help you to decide the next move.
- Actionable metrics help you identify a problem, understand it, and decide on the next action to take.
Total signups are a vanity metric. Activation rate is an actionable metric. Each drop tells the product team where to look.
Common SaaS dashboard design mistakes to avoid
The 12 discussed are the best SaaS design practices. On the other hand, here are common SaaS dashboard design mistakes you should avoid when you are building your product.
- Showing vanity metrics that nobody acts on
- Dumping all metrics onto one screen
- Overusing pie charts
- Showing numbers without a comparison
- Leaving empty and error states undesigned
- Using one dashboard for every role
- Putting decoration (gradients, 3D, glass) ahead of data
SaaS dashboard design examples worth studying
Screenshots of SaaS dashboard examples show what a good dashboard looks like. Here’s a trick for designing dashboards if you are getting into SaaS products: read case studies of good SaaS products. A good case study helps you understand why one works and why one doesn’t.
Each dashboard discussed below has something you can borrow for your SaaS. Treat them as inspiration for your own screens.
Stripe
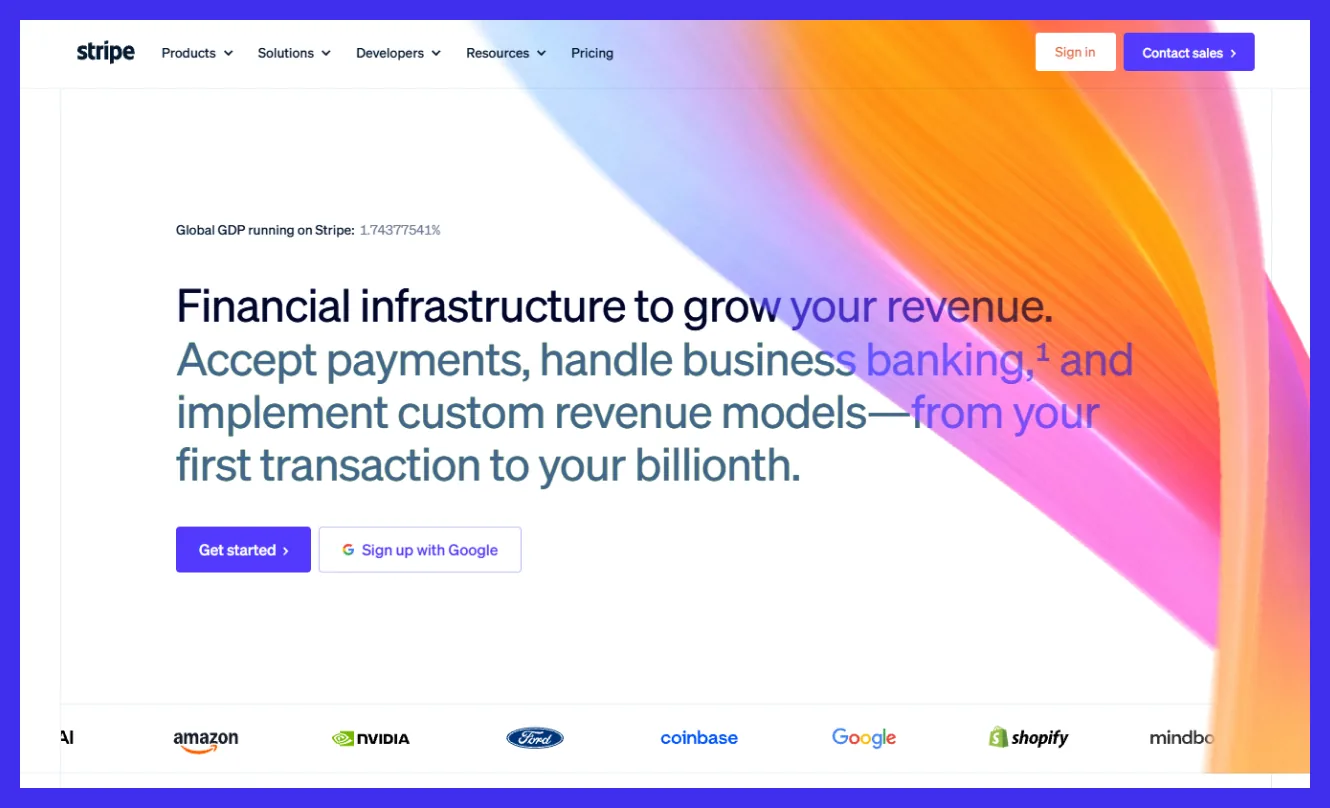
Stripe's homepage combines analytics and charts with a list that needs attention, such as unresolved disputes or identity verifications. Users can easily set a range, compare against a specific timeframe, and add or remove widgets on the overview screen.
What to steal:
- Put action items next to the numbers, so the first screen answers both "how are we doing" and "what needs me."
- Build the comparison section into the page.
- Let the user customize the overview screen. Start with a better default screen and give freedom to users to add or remove metrics based on their preference.
Linear
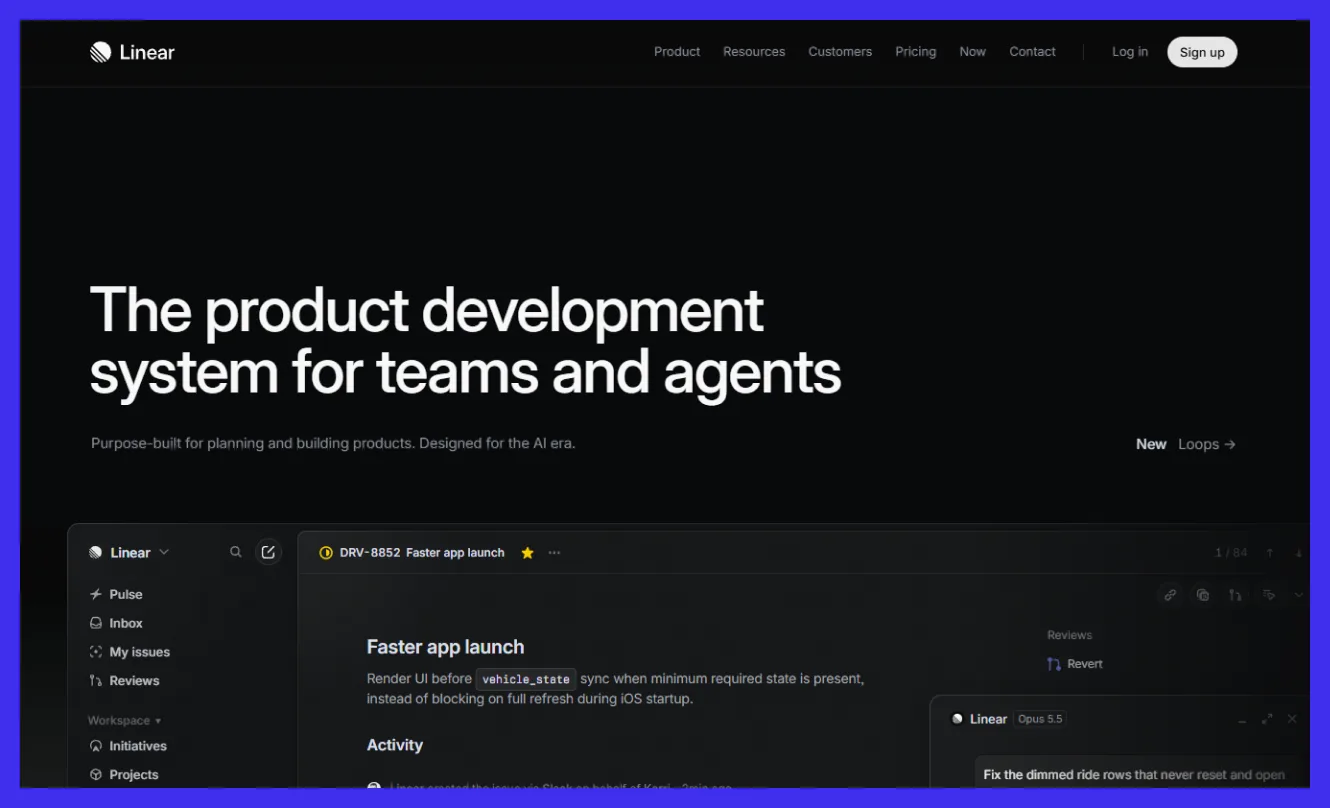
Linear is an issue tracker, not a dashboard. However, its navigation is worth seeing. Users can reorder sidebar items, hide the least used ones, and customize. The March 2026 UI refresh focused on a calmer and more consistent interface design that is easier to scan.
What to steal:
- Let users cut navigation to their own workflow.
- Remove borders and separators that carry no meaning.
- Pay attention to alignments, because even small inconsistencies can make the overall experience feel unpolished.
Tournated
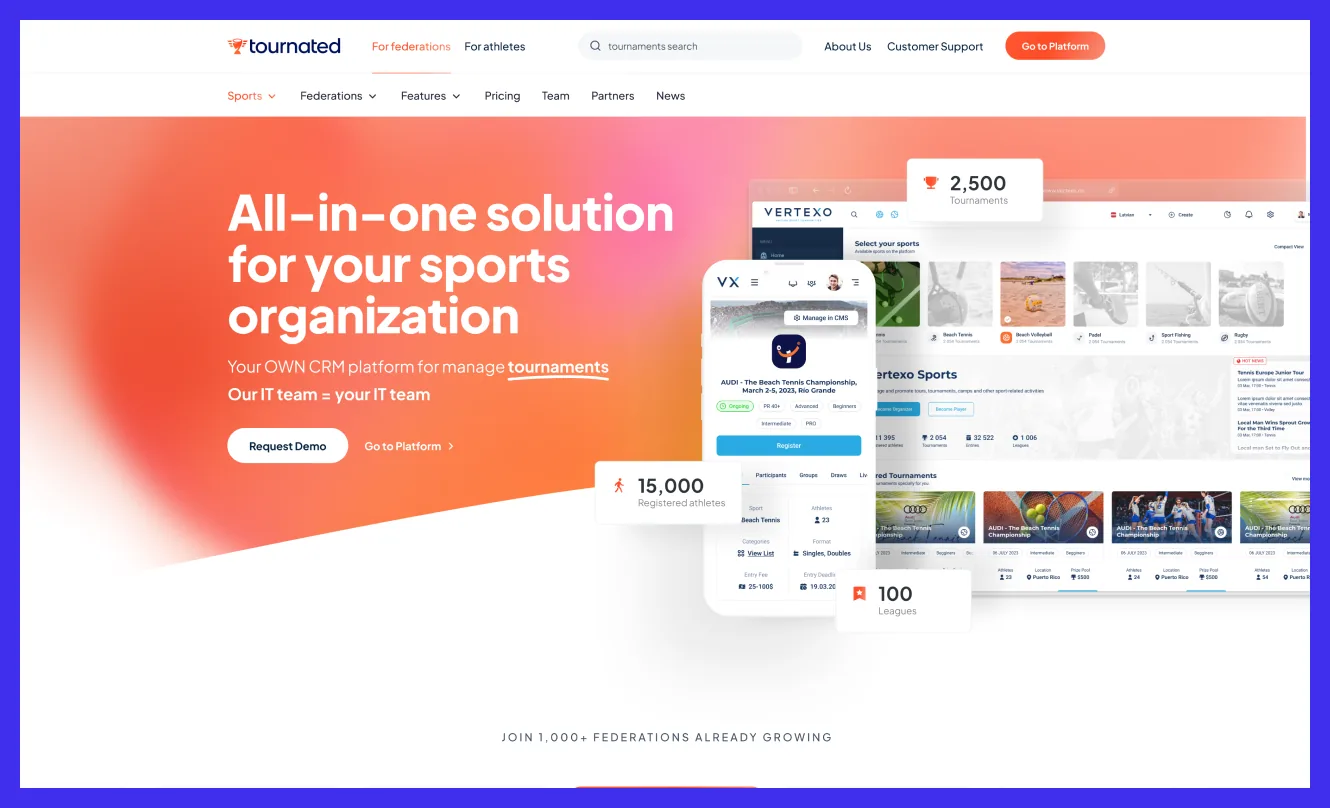
When Tournated came to us, the product was powerful but hard to use. Admins got lost, athletes couldn’t find their schedules, and 70% of new users didn’t know how to start a tournament. So we rebuilt the experience around one idea: every role should see only what it needs.
Federation admins get a clear hierarchy from international to local. Clubs manage members, roles, and entries in one place. Athletes check schedules, results, and rankings in a few taps.
A step-by-step launch flow walks new users through their first tournament, and support requests dropped by 48%.
What to steal:
- Design for roles, not users. An admin and an athlete open the same product for different reasons, so don’t give them the same first screen.
- Don’t drop new users on an empty dashboard. Walk them through the one task that matters most, and the rest gets easier.
- Save your accent color for actions only. We used orange for every key button, so users know where to click without reading the whole screen.
How to design a SaaS dashboard: Step-by-step
If you are planning to build an attractive and lovable dashboard, then this dashboard design process must be followed. This dashboard process is developed after working on digital products.
- Discovery: Interview the stakeholders and users of your SaaS product. Audit the spreadsheet and requirement files. These paint a clear picture of what the dashboard is missing.
- Roles: Define the permissions and controls for each role first.
- KPI and Filter: List the important KPIs (numbers) and show them on the dashboard.
- Wireframe information architecture: Decide how the information will be organized in the dashboard.
- Visual design and data visualization: Make the dashboard look professional and attractive.
- Prototype and test: Create a clickable prototype before going to the full development sprint. Do a 5-second hierarchy test before locking in.
- Dev handoff: Deliver the design with proper documentation. It will make your development much smoother.
- Launch: Release to your user, check support tickets, and maintain the integrity.
How much does SaaS dashboard design cost?
A SaaS dashboard design usually costs $5,000 to $15,000 for an MVP, $15,000 to $40,000 for a growth-stage product, and $40,000 to $100,000+ for an enterprise platform. These are typical market ranges for dashboard design, not development.
However, SaaS dashboard design cost depends on a handful of factors, and the biggest is project scope. The bigger the scope, the higher the cost.
Here is what pushes the price up or down:
- Roles and dashboard count: Each role is a separate set of decisions to research and design.
- Data complexity: Sources, custom functions, and tables take longer than a few clean metrics.
- Design system: Building on an existing design system is faster than creating one with the dashboard.
- States and edge cases: Empty, error, partial-data, and permission states increase time to finish.
- Research depth: Interviews and testing take time but reduce rework.
Conclusion
A good dashboard design helps users complete tasks faster and keeps them coming back. Making a dashboard is easy, but making it enjoyable is the toughest part of designing a dashboard. You can make the best dashboard design by following the dashboard design process above.
If you want to start this Monday, do the four things to make an existing dashboard. List the decisions made for each role and find out if the dashboard widget supports them accordingly.
Cut unnecessary things or move things that don't support the decision below the fold. Check every state (empty, loading, error) and put a comparison next to every number.
Lastly, get help from a SaaS product agency if you find it overwhelming. Wavespace is a SaaS design agency with proven enterprise and startup SaaS solutions. We can assist you to make the best dashboard on the market.
FAQs about SaaS dashboard design

A SaaS dashboard is the main part of a software-as-a-service application. It is the visual interface of an SaaS product that shows metrics and visualizes data. Which is used to control the SaaS product. With it, a user can run business tools, perform tasks, collect and organize operations, and display real-time data.
Clarity and visual hierarchy make a SaaS dashboard design good. It is done by prioritizing information and rearranging them. In simple words, show the actionable data at first, make it understandable, leverage charts and metrics, and order them by their importance.
A good UI/UX dashboard design practice is to keep 5–7 KPIs above the fold. However, not every SaaS dashboard needs the same amount. Keep enough to take action. Remove the unnecessary KPIs or hide under a button.
A SaaS dashboard includes user authentication, analytics and data visualization, KPI tracking, subscription and billing management, user management, notifications, reporting, integrations, role-based access, and responsive design across multiple devices.
Follow Wavespace’s Anatomy of SaaS dashboard design to achieve an industry-standard dashboard layout. The best SaaS dashboard layout includes a sidebar navigation, top navbar, clear page header, KPI cards, primary chart, supporting widgets, sortable data table, prioritized activity feed, and helpful empty states.
Yes, every dashboard should have dark mode as a preference option. Not only because roughly 82% of daily internet users prefer using dark mode, but also because it improves eye comfort in low-light environments and gives users more flexibility.

More related blog



Design & development in one team. Let’s talk!


















Francisco, CA 94105, United States